How Liquidity Affects the Forex Market
What is Take Profit and Stop Loss
Understanding brokers, liquidity, and volatility in Forex
Bifu Forex Trading Beginner’s Guide
Understanding Pips in Forex Trading
What is Currency Pair?
What is a Candlestick?
What is Forex Trading?
Differences Between Major, Minor, and Exotic Pairs
Understanding Forex Leverage and Margin
What is Leverage and Margin?
What is a Candlestick?
09/09/202507:36:46
Candlestick charts are an essential tool for traders to visualize and interpret market data. If you're just starting out with trading, understanding how to read candlesticks is a crucial first step toward making informed decisions. In this post, we’ll break down the basic structure of a candlestick and show you how to use them in your trading strategy.
What is a Candlestick?
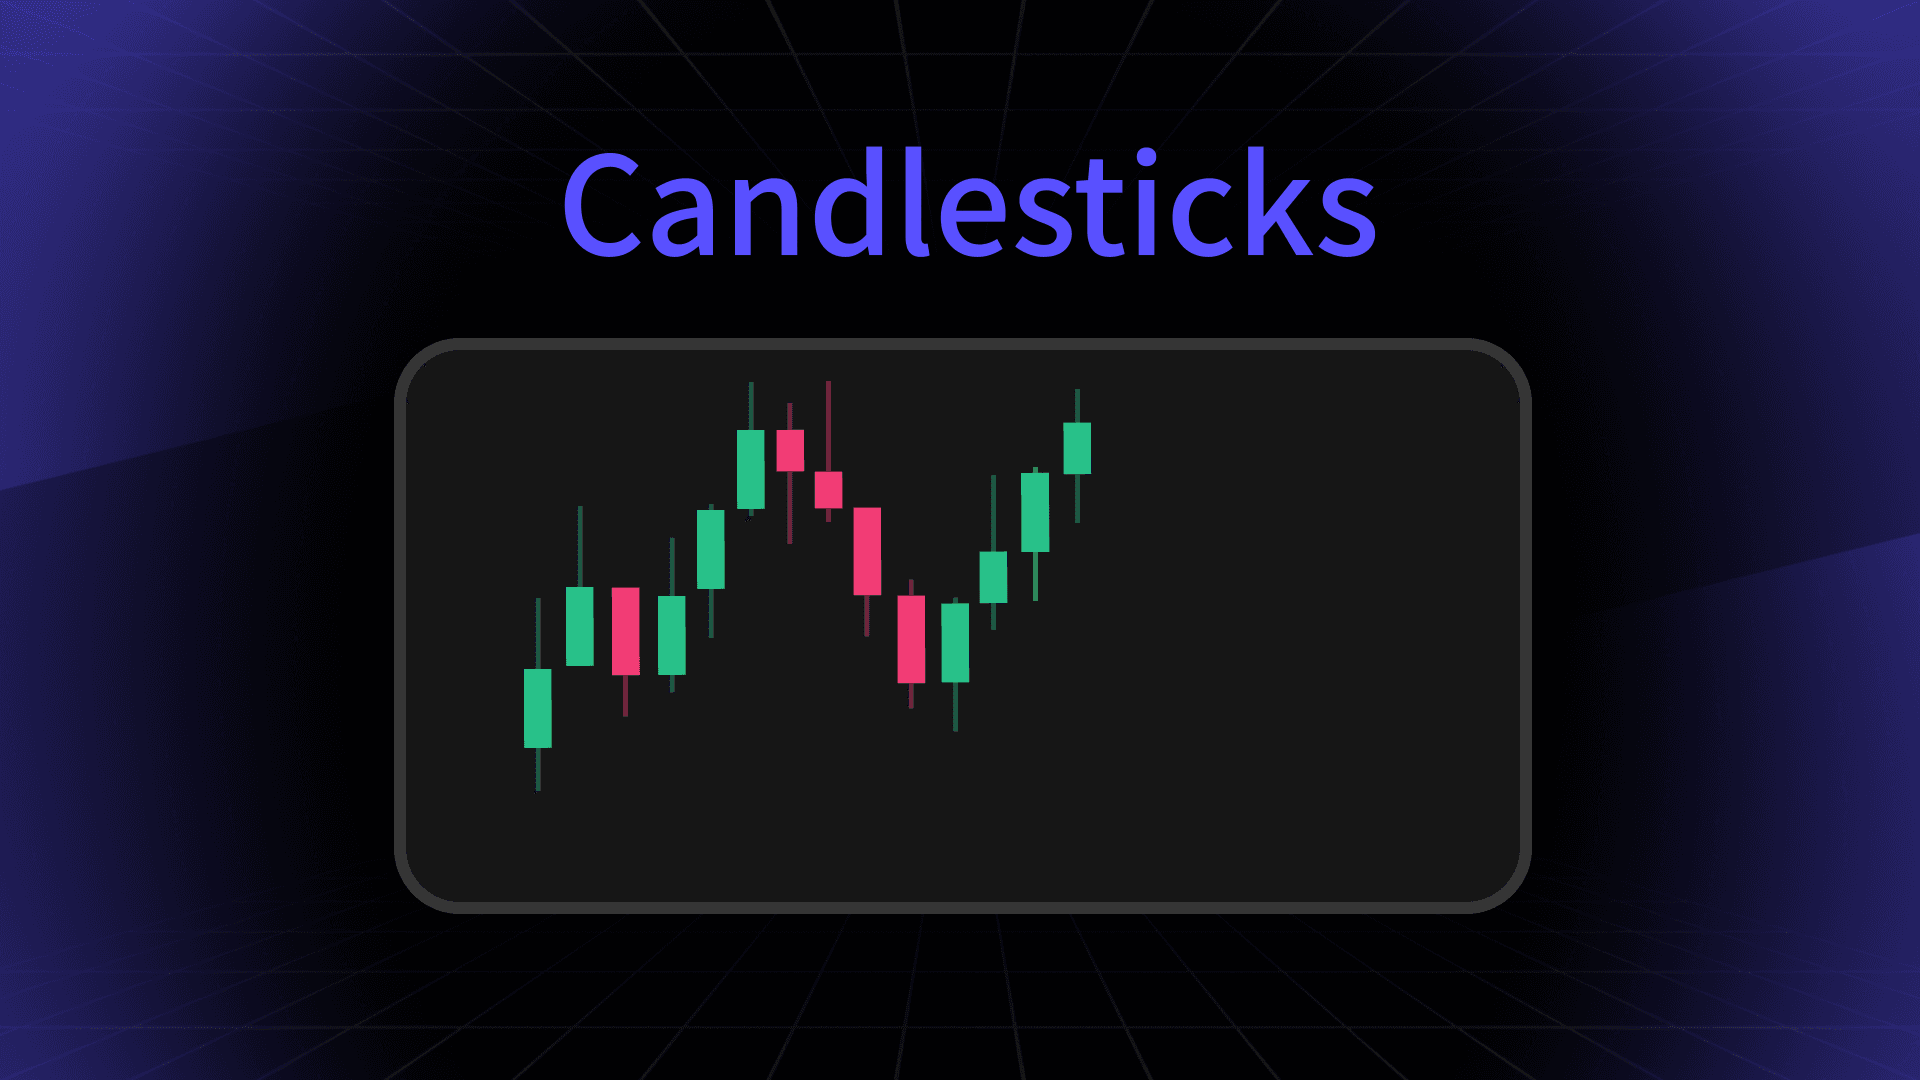
A candlestick represents price movement within a specific period, showing four key data points: the opening price, the closing price, and the highest and lowest prices during that period. Candlestick charts give traders a quick snapshot of market activity and sentiment.
Each candlestick has two main components:
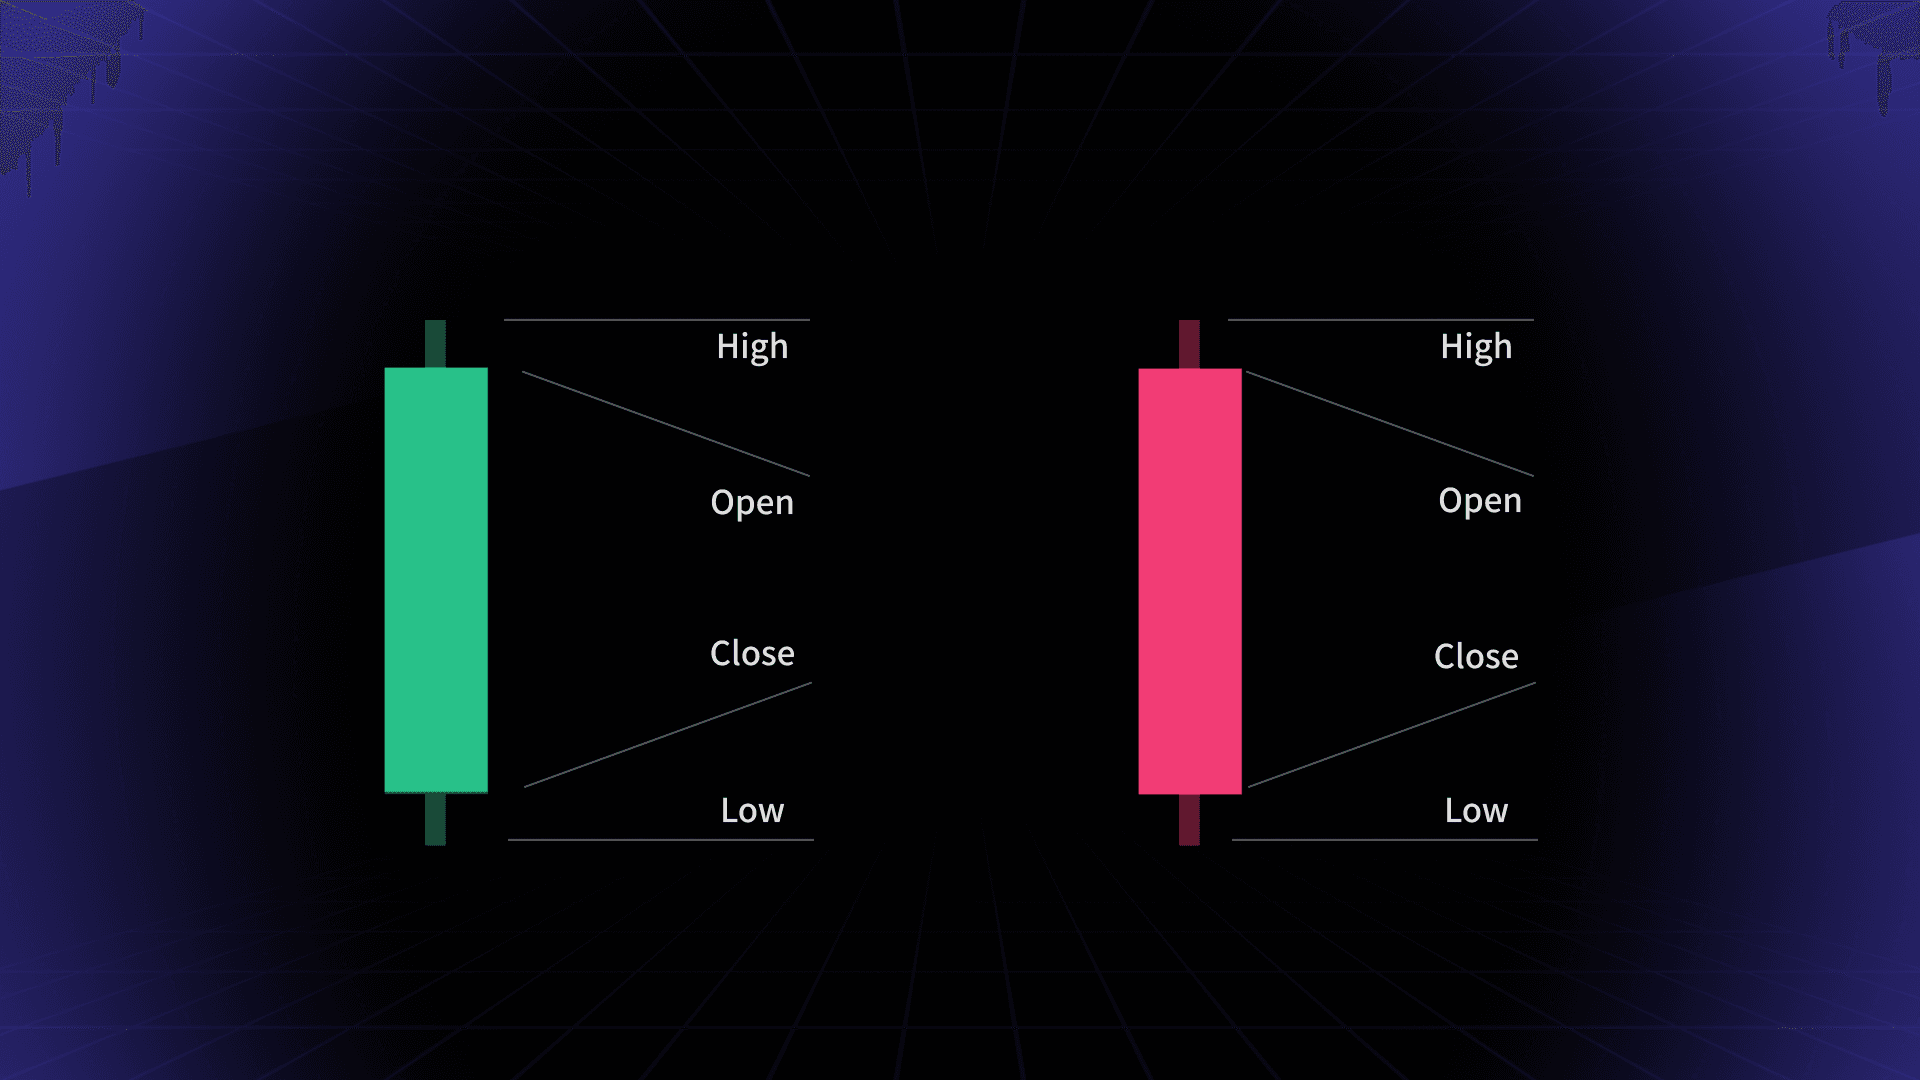
The Body: The thick part of the candlestick that represents the range between the opening and closing prices.
The Wicks (or Shadows): The thin lines extending from the body, showing the highest and lowest prices during the time period.
Bullish vs. Bearish Candlesticks
Candlesticks can tell you at a glance whether the market is moving up or down:
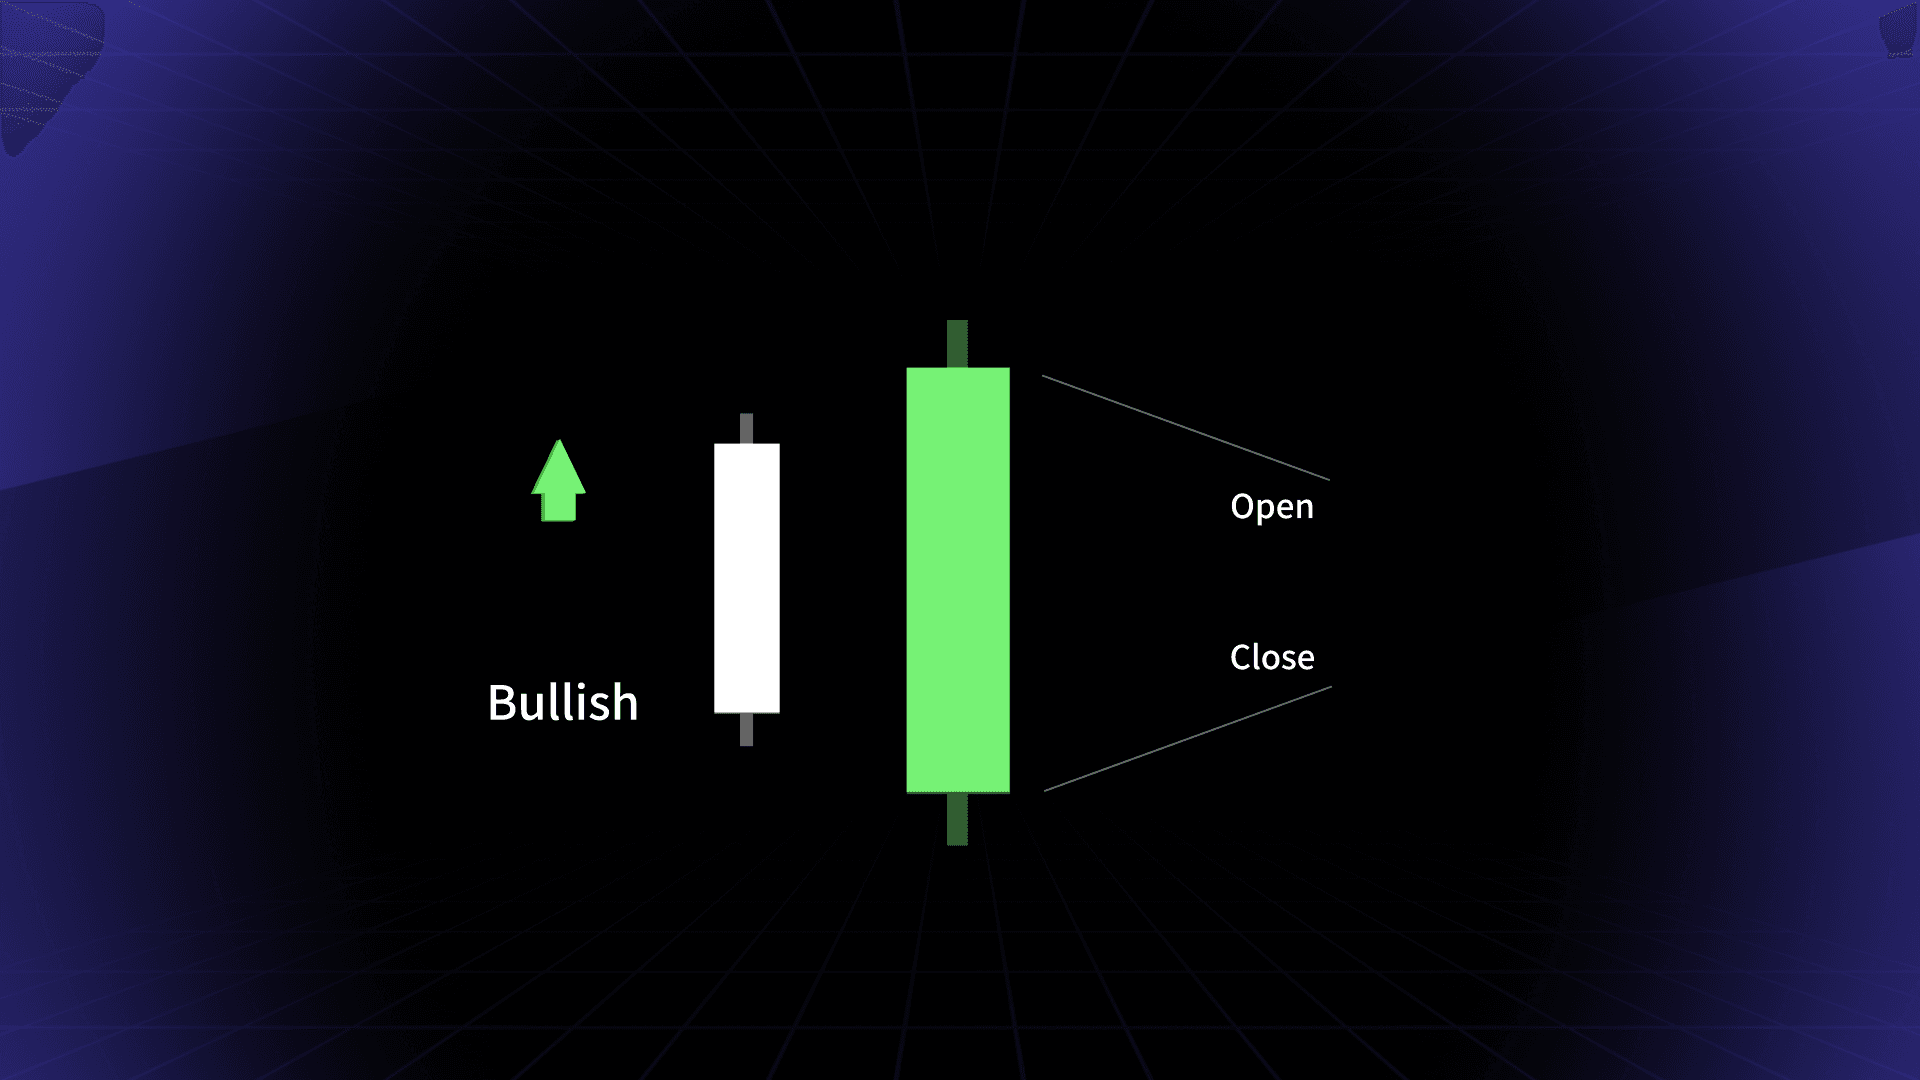
Bullish Candlesticks: When the closing price is higher than the opening price, the body of the candlestick is typically green or white. This indicates that buyers were in control during the time period, and prices moved upward.
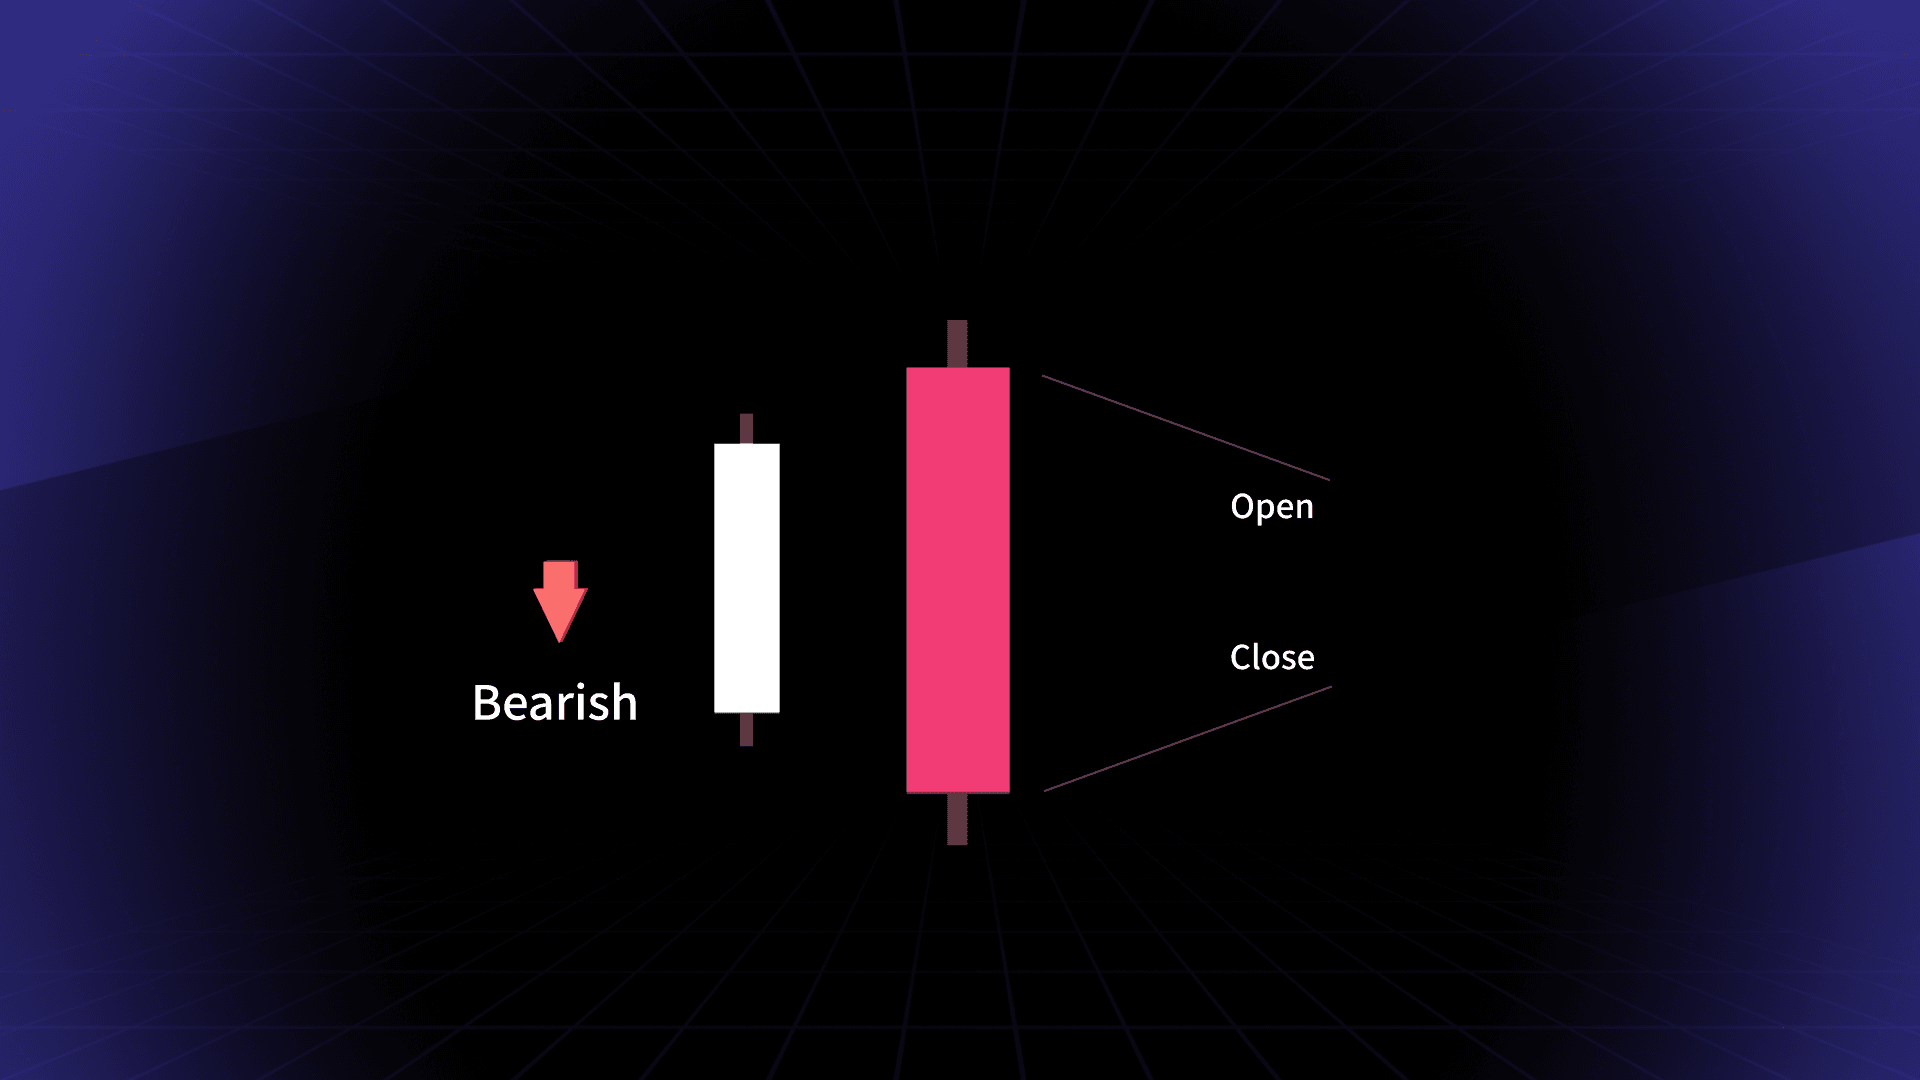
Bearish Candlesticks: If the closing price is lower than the opening price, the body is usually red or black. This signals that sellers were dominant, pushing prices downward.
What Do Wicks Tell You?
Wicks (or shadows) are important indicators of market volatility. The upper wick shows the highest price reached during the time period, while the lower wick shows the lowest price.
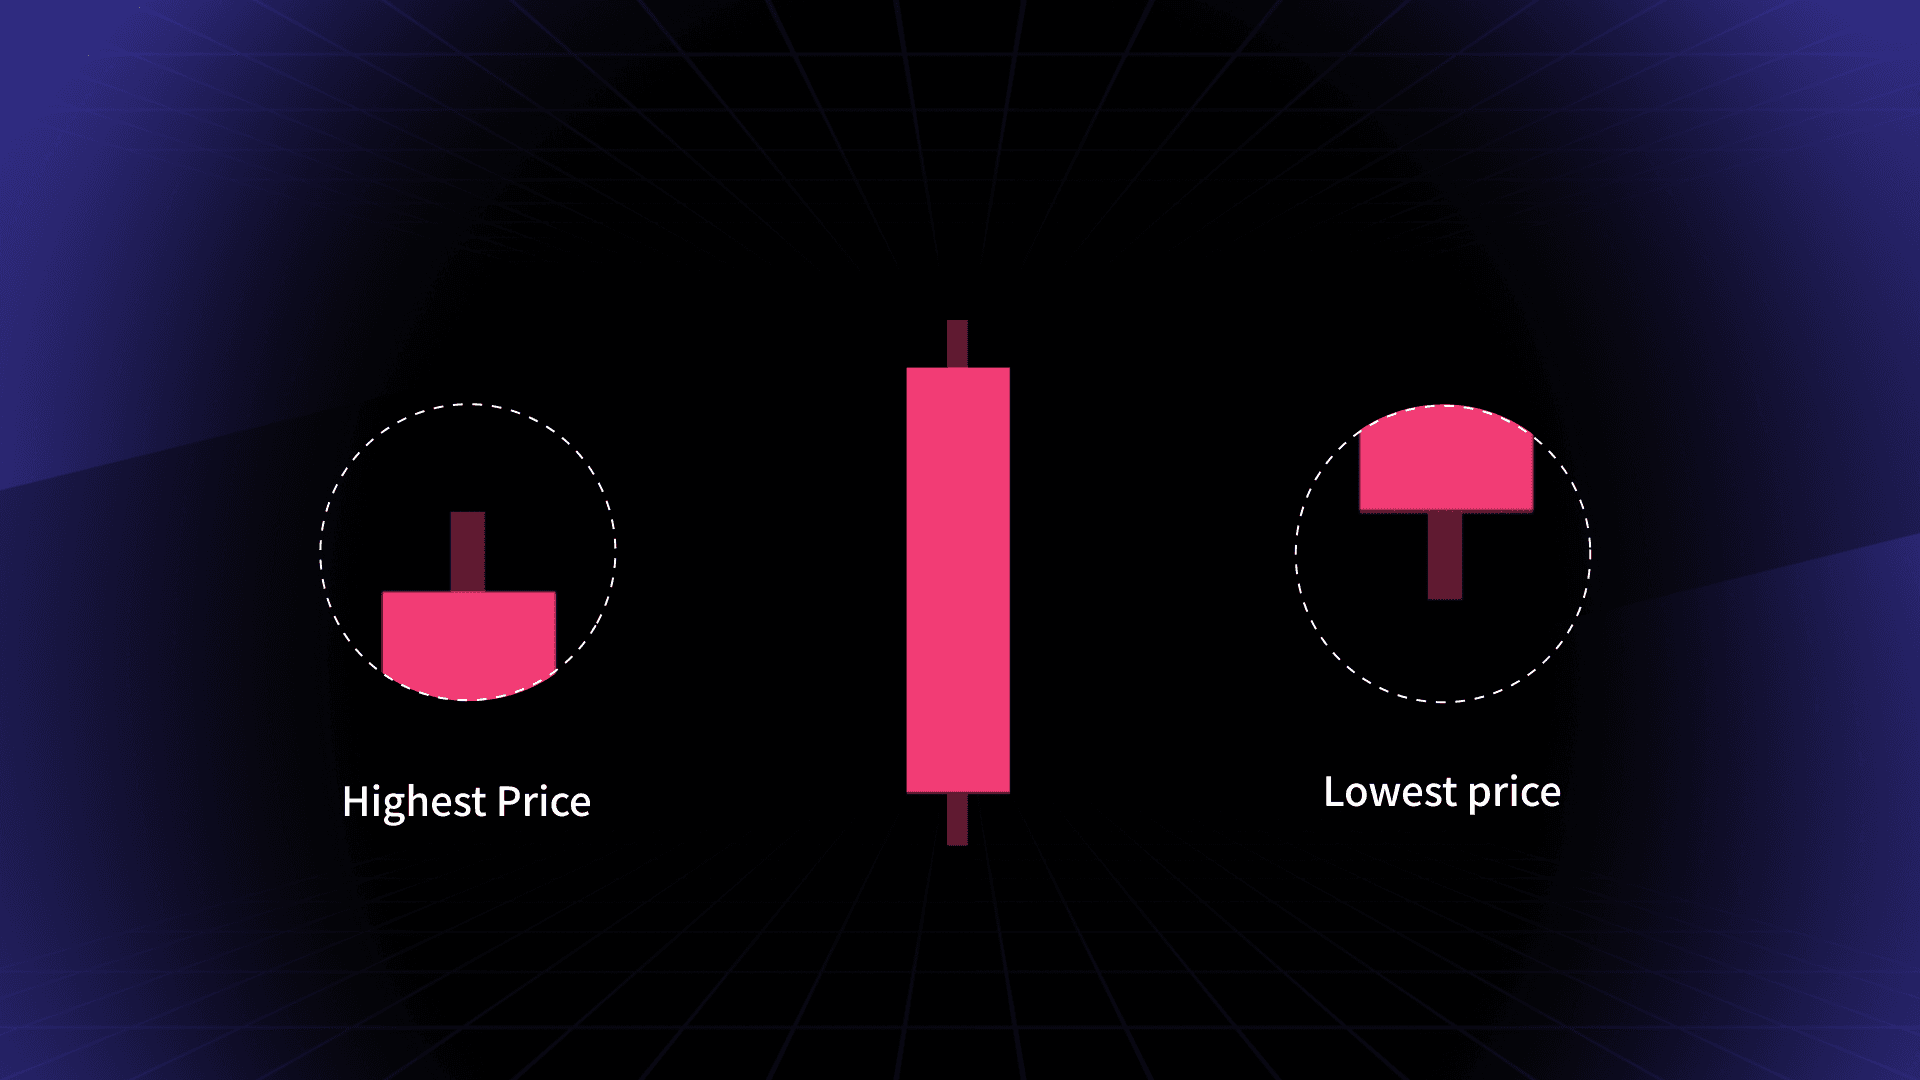
Long wicks: If you see a candlestick with long wicks, it suggests that there was a lot of price movement, but the price didn't settle near its highest or lowest point. This could indicate indecision in the market.
Short wicks: Short wicks suggest that prices stayed relatively close to the open or close, indicating a more stable market.
Why Candlesticks Matter
Candlesticks offer more than just numbers—they provide a visual representation of price action that can help you gauge market sentiment. For example, clusters of bullish candlesticks may indicate that the market is trending upwards, while a series of bearish candlesticks may signal a downtrend.
By paying attention to candlestick patterns, you can anticipate potential price movements and adjust your strategy accordingly. Whether you're day trading or investing for the long term, understanding candlesticks is a vital skill for success.
A Practical Example
Let’s look at an example. Imagine a candlestick chart showing a specific trading day. You see a bullish candlestick with a long upper wick and a shorter lower wick. This indicates that the price opened low, climbed significantly, but then settled slightly lower than the high, reflecting some pullback in price before closing higher than it opened.
Now, take the reverse scenario, a bearish candlestick with long wicks. This could signal that although the price dropped, there were periods of buying pressure during the day, suggesting a potential trend reversal.
Conclusion
Understanding the basics of candlesticks is just the beginning of your trading journey. By mastering how to read them, you'll gain insights into market trends and make more informed decisions. Candlestick charts are simple but powerful tools that, when combined with other analysis techniques, can significantly enhance your trading strategy.
Official Social Media
Disclaimer
Bifu always values compliant operations and strictly adheres to the laws and regulations required by local regulatory authorities. The content of this article is for general information and educational purposes only and does not constitute any form of advice, recommendation, or guarantee. Please ensure that you understand and comply with the relevant laws and regulations of your country or region before using this platform.
Before investing, please assess your own risk tolerance and seek professional advice if necessary. You are fully responsible for your investment decisions, and Bifu does not assume responsibility for any losses arising therefrom.